Hello Dallas.
Now that we’re hot off of 2014’s North Texas Beer Week… Have you ever wondered what Dallas’s favorite local craft beer is? You’re probably thinking “Yeah, it’s clearly Lone Star because it’s the ‘National Beer of Texas'”, or “duh – it’s the one in my hand right now, bro!”.
While valid guesses, they are clearly not correct (and you should feel bad about those guesses). The correct answer is: Lakewood Brewing Company’s “Temptress” – a milk stout. Now Dallas – you’re probably now thinking “Well, Lone Star and the beer in my hand are clearly the second and third favorite local craft beers.”
Well… this is the point where I ask you to stop thinking such terrible thoughts – those answers are also not correct (and you should continue to feel bad). The correct answers are: Peticolas Brewing Company’s “Velvet Hammer” — an imperial red — and Community Beer Company’s “Mosaic IPA” — an American-style IPA.
How do I know that Temptress, Velvet Hammer, and Mosaic IPA—in that order—are Dallas’s three favorite beers? These beers are on tap, or (for Temptress and Mosaic IPA) on shelves all across town. But just being available doesn’t make a beer Dallas’s favorite – or else those truly wretched thoughts you were having about Lone Star would have been true.
Well as a beer nerd and a stats nerd, I decided I just had to know: of all the local craft beers that are now produced and available throughout DFW – which are Dallas’s favorites? Let’s get nerdy.
I created a relatively simple survey on Google Docs. This survey listed 35 beers produced in (the broader) DFW area. For a beer to get on the list it had to meet the following criteria:
- The brewery itself must have been in operation for at least 1 year
- The beer itself must have been available for at least the past six months
- It has to be a year-round beer (no seasonals, specials, or one-offs)
That qualified 35 beers from the following breweries1: Franconia, Peticolas, Revolver, Martin House, Four Corners, Lakewood, Rahr, Deep Ellum, Community, and Cedar Creek.
When I had my list, I randomized the order in which these beers were listed and sent the survey out. Here’s a quick breakdown of some demographics:
- 202 respondents. One was excluded2.
- Gender: 36 Females, 160 Males, 1 Meat Popsicle, 1 Unicorn, 1 Manatar, and 3 non-responses.
- 33 People professionally work with beer (brewer, bartender, waitstaff, etc…).
- 58 People consider themselves homebrewers.
The survey asked people to respond to each beer with one of the 6 following options 3:
- It is one of my favorite beers.
- I like this beer.
- This beer is OK.
- I don’t like this beer.
- I’ve never had this beer.
- I have no opinion.
At this point, we can just count how many people, out of 201, had the answers above for each of the beers in the survey. So let’s get down to it:
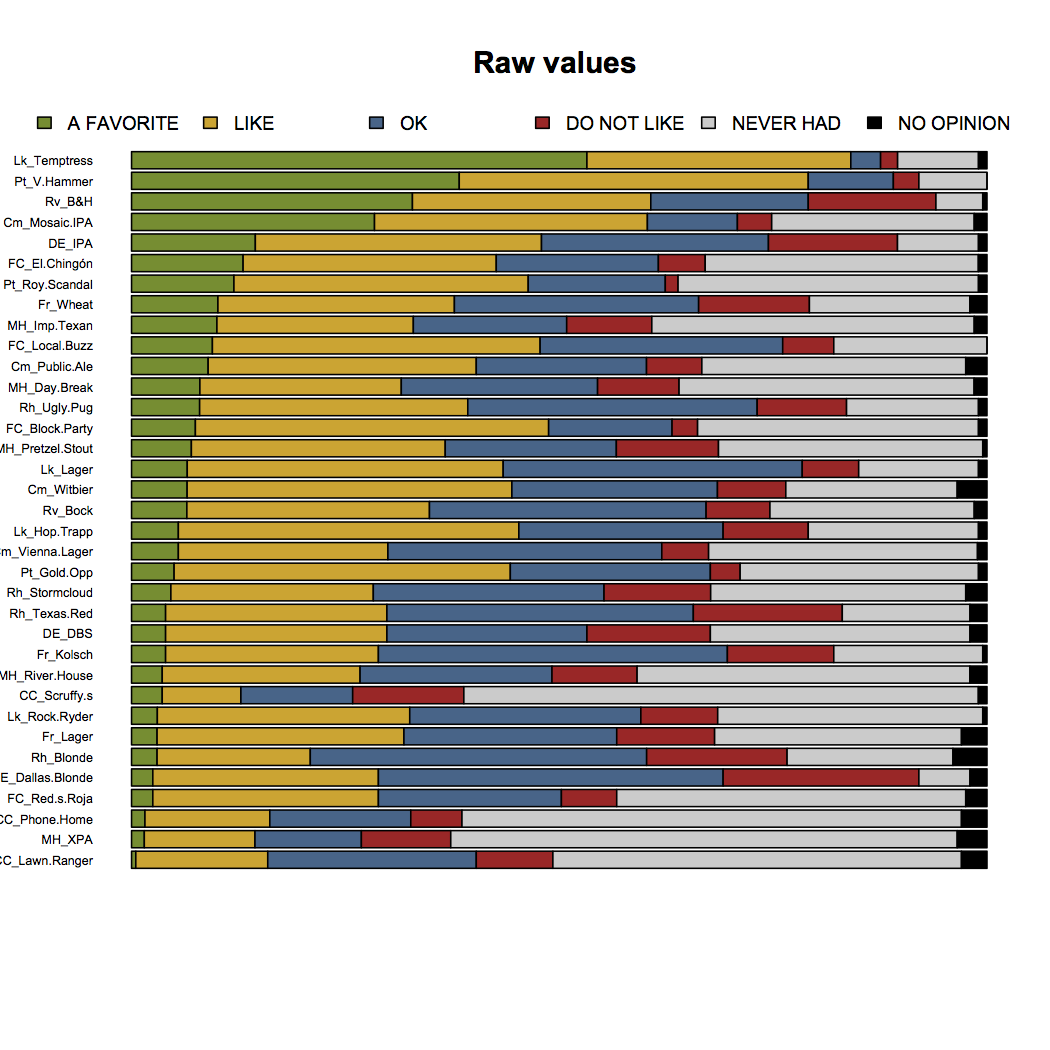
There are some clear favorites: Temptress, Velvet Hammer, Revolver’s Blood & Honey, and Mosiac IPA all have a lot of “Favorite” responses. You might be thinking, “Yo, Derek, you didn’t say a thing about Blood & Honey before—that’s my go to crushable—so maybe you’re lying about Lone Star too?”. If I were inclined to respond to such accusations, I’d say that 1) I’m building suspense (or boring you to tears) and 2) I’ve grown really tired of you talking about Lone Star – but I’m above that so I won’t say it.
As a stats nerd, though, this picture feels a bit… rudimentary. There are better ways to figure out and visualize Dallas’s favorite beer. So let’s turn to one of my favorite statistical methods: Correspondence Analysis (CA). CA is a technique that takes a large table made up of a bunch of variables (here: the responses) and turns them into new variables that better represent what’s happening4.
The data from above looks something like this:
| Beer | FAVORITE | LIKE | OK | DO NOT LIKE | Never Had | No Opinion |
|---|---|---|---|---|---|---|
| Lakewood Temptress | 107 | 62 | 7 | 4 | 19 | 2 |
| Four Corner’s Block Party | 15 | 83 | 29 | 6 | 66 | 2 |
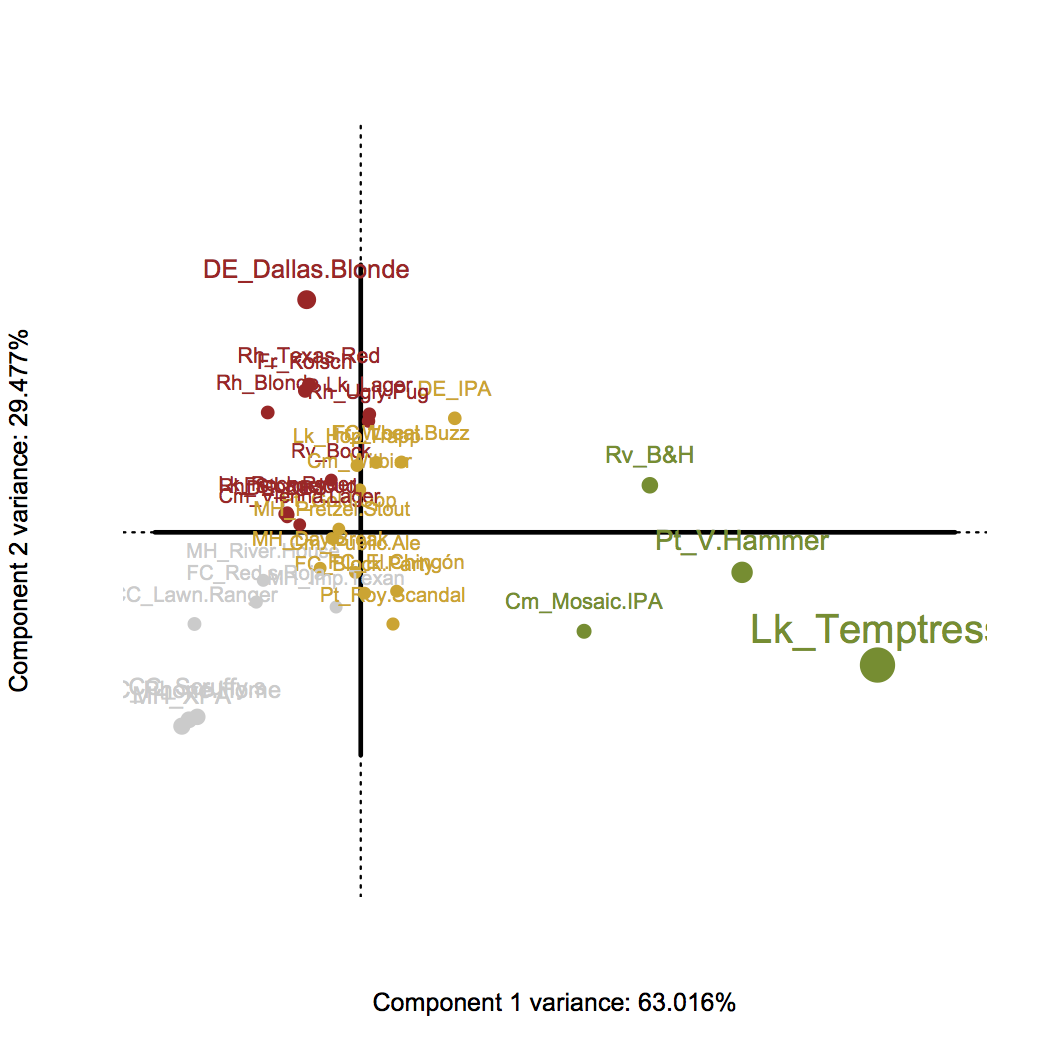
So what will CA do for us with a table of data like this? It tells us which beers are most similar to one another – based on all the different categories. It can also tell us if any of the categories are similar to one another, too. Most importantly, it tells us which beers are more related to responses than other beers. Let’s take a look at what a CA would produce:
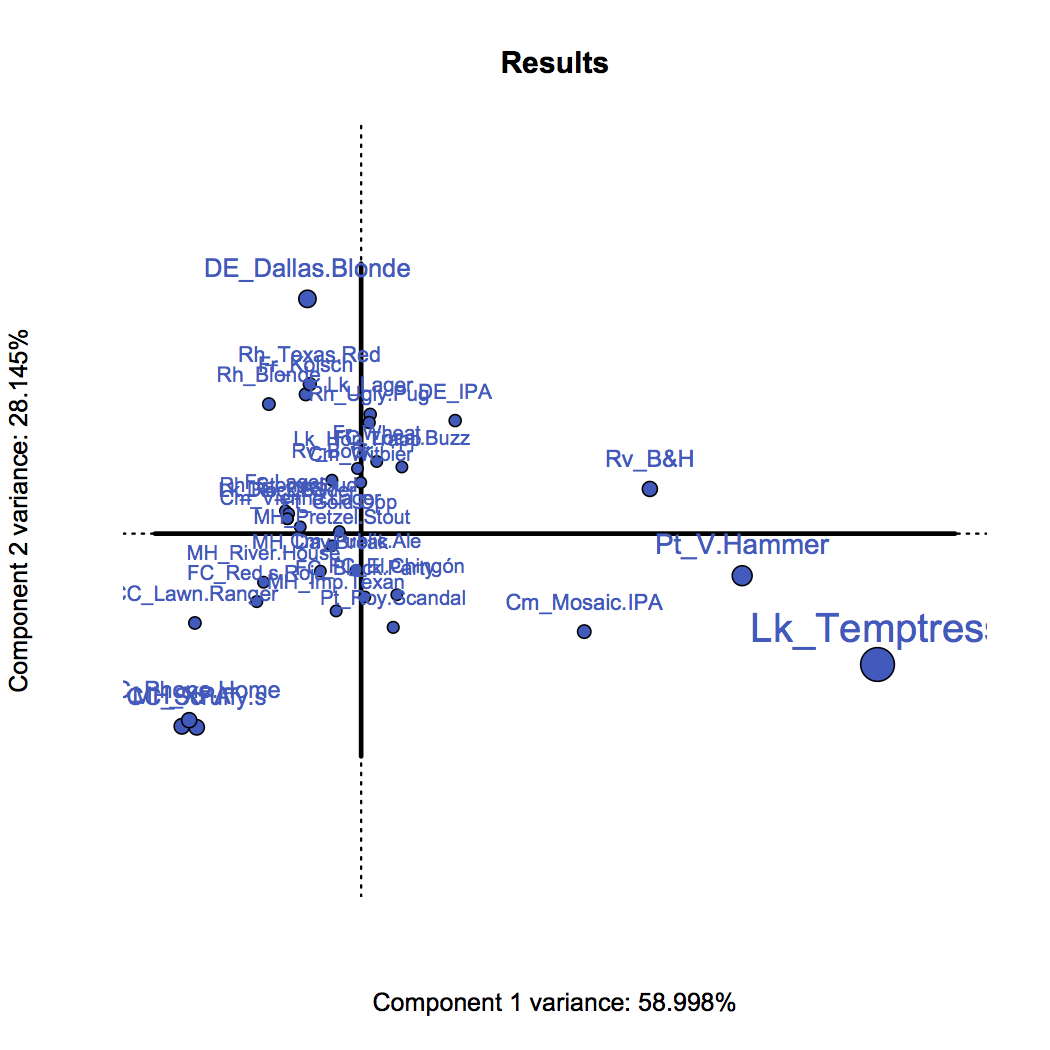
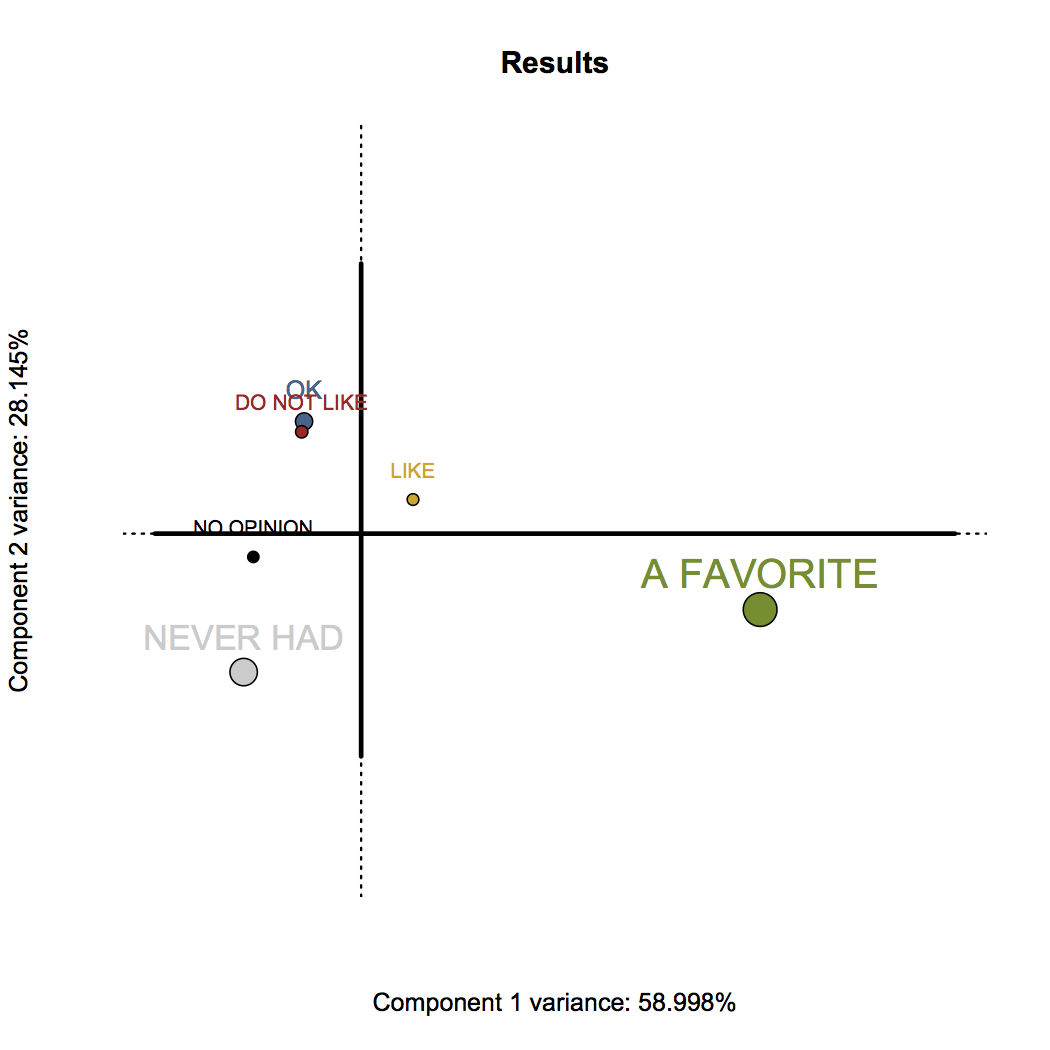
CA produces for us these new variables—these variables are called “components”—denoted by the axes (horizontal and vertical lines) in these pictures. There are 3 other axes besides these – but those aren’t very important. Just these first two explain 87% of the entire data.
With what we know about CA we can say some of the following:
- Temptress, Velvet Hammer, Blood & Honey, and Mosaic are more associated with “A FAVORITE” than other beers (both figures)
- The responses of “OK” and “DO NOT LIKE” are essentially the same – which probably means people are being nice when they say “OK” or they’re being mean when they say “DO NOT LIKE”.
- The lower left of the left figure shows Cedar Creek Scruffy’s, Cedar Creek Elliot’s Phoned Home, and Martin House XPA – which means they are nearly identical based on their responses; the responses being that most people haven’t had these beers. Sad times.
Let’s go a bit further. We know a bit about this data to, perhaps, make it easier to understand. Let’s combine “OK” with “DO NOT LIKE” – because they are basically one in the same here. We’ll also combine “NO OPINION” with “NEVER HAD” – so that we can group together the responses that are basically non-responses. Let’s do another CA and this time color each beer by the responses they are most similar to.
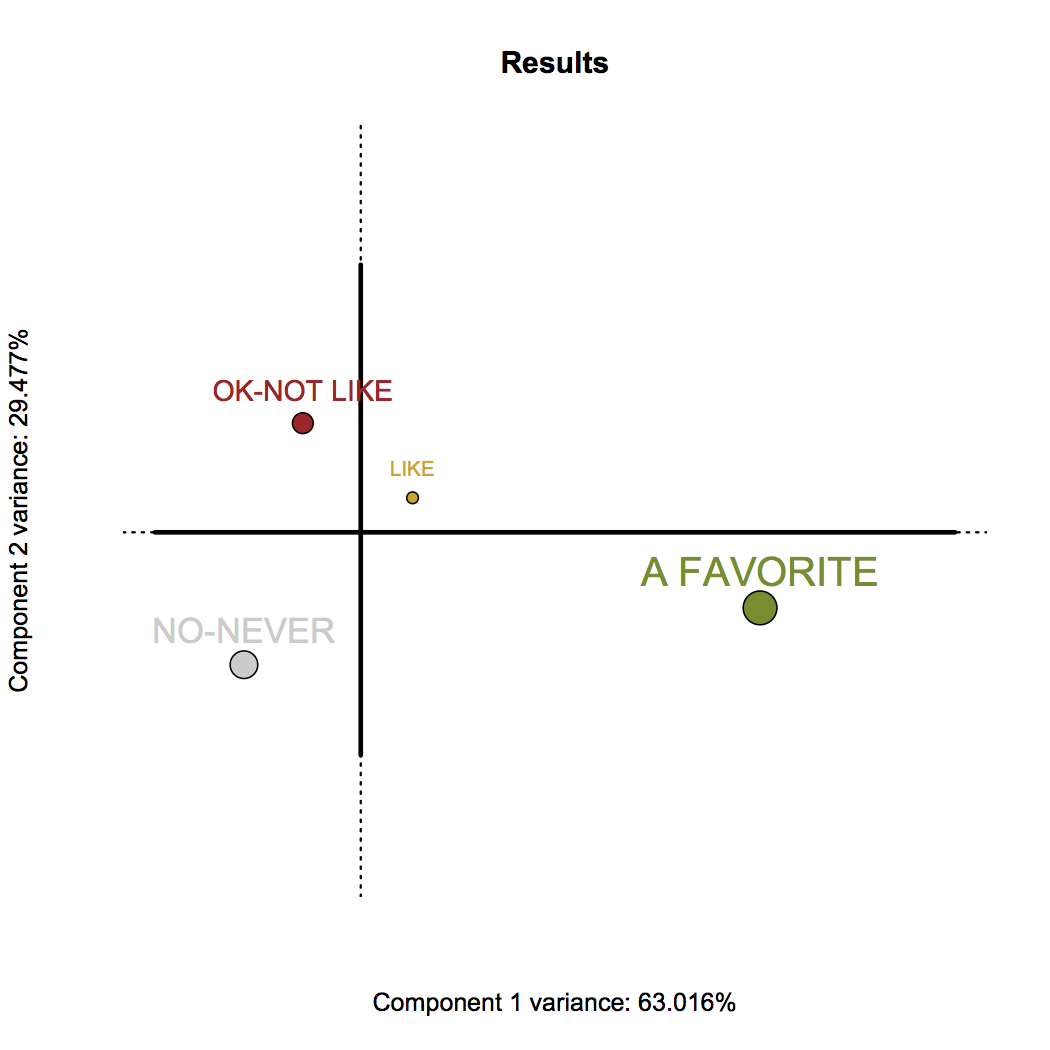
With the combined responses – we can see the general configuration is essentially the same. Except this time we can explain 92.5% of the data instead of just 87% (take that Lone Star!). It’s also a little clearer that from right to left is a gradient of liking (or ever having) a beer. Now let’s take a look at the beers, colored by which response they are most similar to:
Now we have a much clearer idea of which beers people have never really had (in gray), which ones are not particularly cared for (in red), which ones are liked (in yellow), and which are Dallas’s favorites (in green).
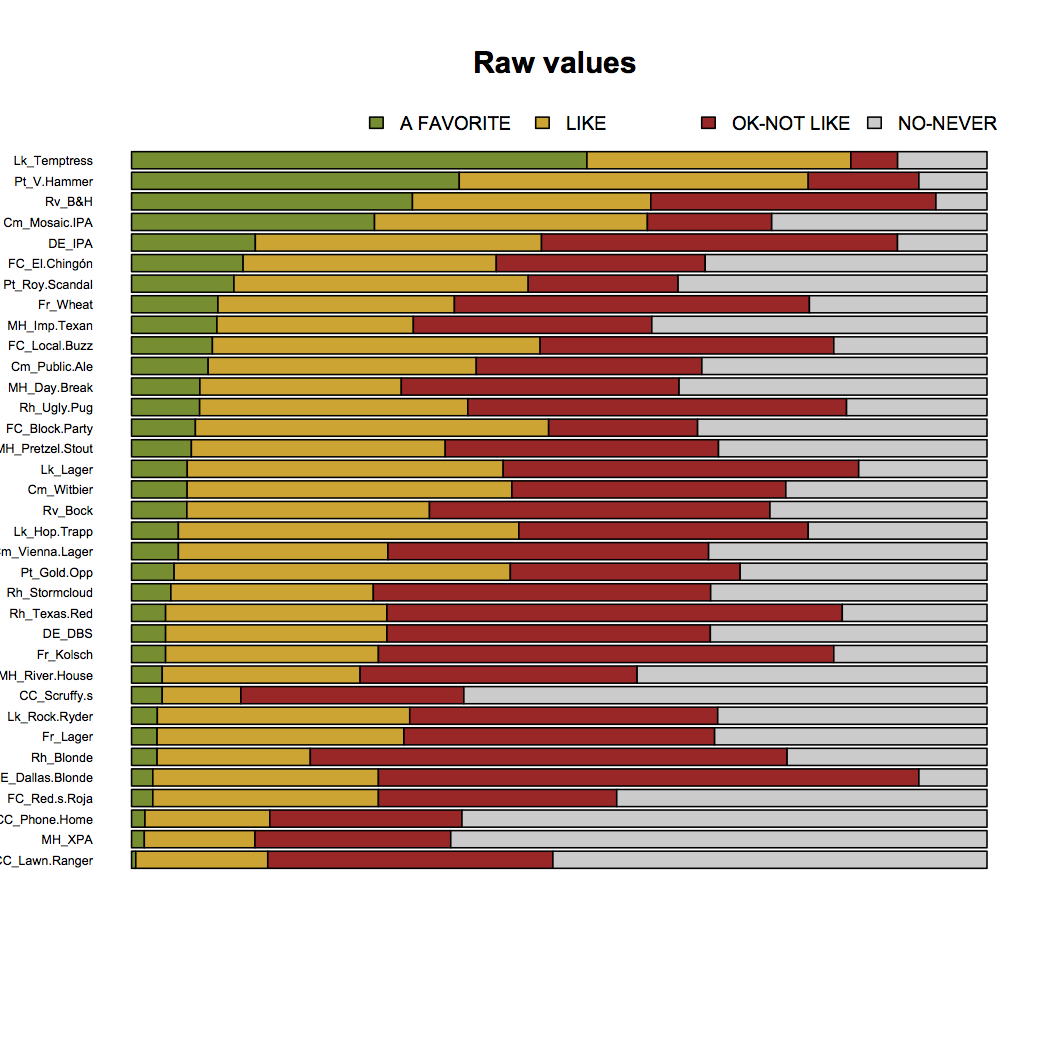
The favorites are still Temptress, Velvet Hammer, Blood & Honey, and Mosaic. So why did I exclude poor ol’ Blood & Honey from the top 3? Let’s take a look at the responses in these 4 categories like we did initially. Beers are sorted by those with the most “A FAVORITE” responses:
Let’s also look at beers sorted by fewest responses of “OK/DO NOT LIKE”:
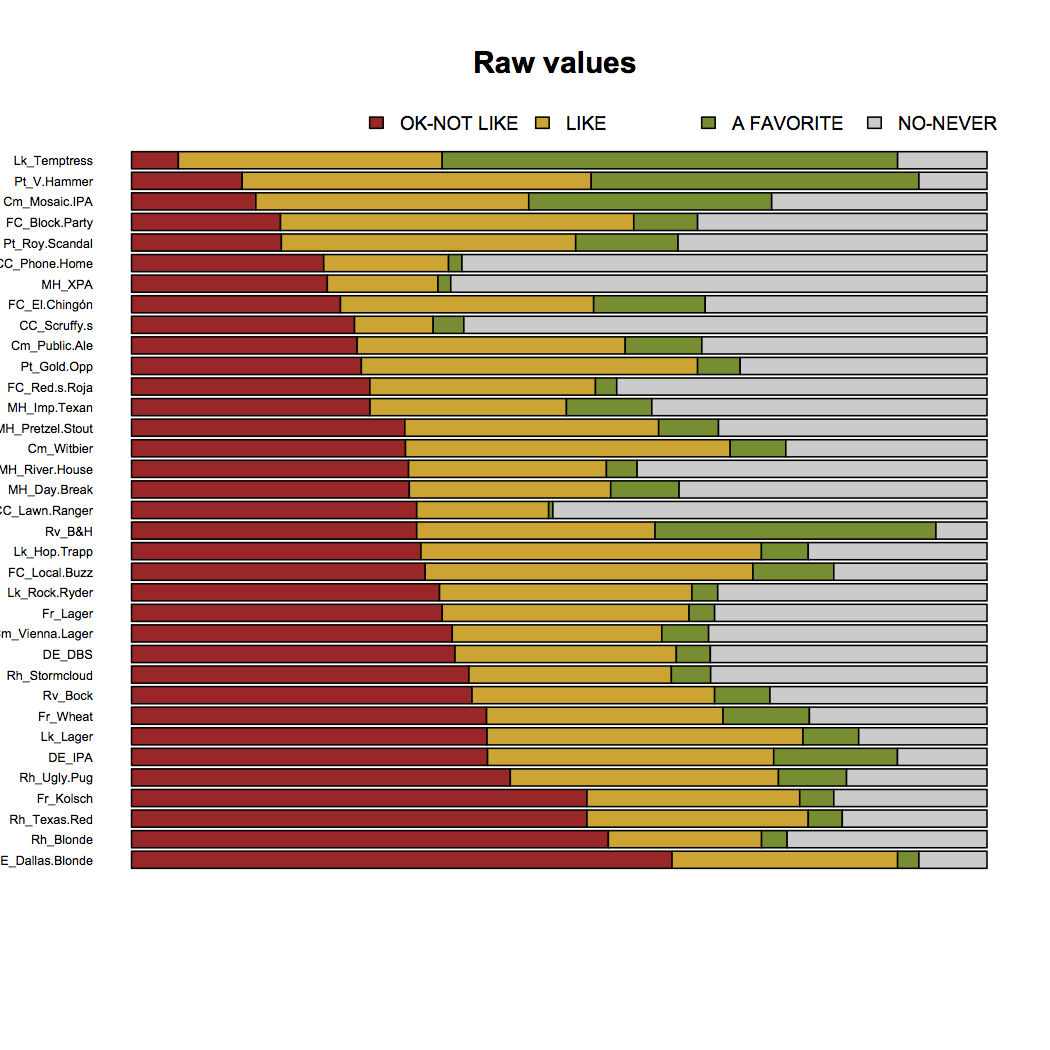
Now we have a bit different of a perspective – one that we can also get directly out of the CA results. Some beers are very related to “A FAVORITE” while at the same time rarely ever get a “DO NOT LIKE”. Unfortunately for Blood & Honey – the responses for “A FAVORITE”, “LIKE”, and “DO NOT LIKE” are equally likely.
But for Temptress, Velvet Hammer, and Mosaic IPA – very few people would say they “DO NOT LIKE” these beers. Thus, these three beers—in that order—are Dallas’s favorite beers. And that’s just science.
So what’s next? In about a year I’ll try to re-do this survey. That’s because by then approximately 30,786 breweries are, apparently, going to be open in Dallas (thanks, urban sprawl!), and many of the breweries that are currently open—but didn’t qualify this time—will qualify in a year.
All analyses performed in R. Correspondence Analysis was performed with the ExPosition package – a package created by particularly attractive and smart people. Data available here5. Code to recreate these analyses here6.
I’m tired just writing this and I’m sure you’re tired just reading it. So let’s go get some Lone Stars.
Footnotes
1 I had only realized after I sent out the survey I had made 2 glaring errors. I mistakenly excluded Firewheel and Armadillo Ale Works. Woops – sorry!
2They responded with “I’ve never had this beer” to all beers.
3For the stats nerds: these are survey options not usually seen. Often times when you get a survey, you’re asked to respond with a 1, 2, 3, 4, or 5 (or some similar numeric scale). Well, what if people have no opinion? What if they don’t want to answer the question? They need a way to opt out. Also, categories aren’t numbers, you dummy! For your (statistical) health!
4 For the stats nerds, technically both the beers and the responses are variables. The observations (people) are kind of hiding. Each person simply helps increase the number of responses within a particular cell of this table. CA is analogous a principal components analysis but for data more suited for χ2 analyses.
5Some responses are decimals. This is because some people left their responses blank (instead of choosing the very comprehensive categories I outlined – jerks). When a response was blank, I just replaced it with the average response.
6It’s in a text file, but, change the extension to .R to use it more easily with R.
I am curious about your sample! Sampling technique is meaningful here. It sounds like you sent it to craft beer appreciators? Possibly a construct validity error. Sounds like you might be conflating “the favorite beer in Dallas for those with good taste” as opposed to “the favorite beer of Dallas.”
Second, why not PCA instead of CA? Your outcome, as noted , is nominal-sort-of-ordinal. Maybe you’re lumping them together here? (As an aside to footnote 3, at least in the psychometrics world, treating ordinal data like interval data is considered an OK practice if you have enough points (5, sometimes 7) and you believe that there’s a continuous distribution that underlies the ordinal scale. Maybe you’ve done that here?)
I feel a little iffy on your collapsing…no-never is neater, but it seems like the clusters are really distant? No opinion seems like it’s almost as close to the ok-not like cluster as the never had cluster. And I do think they’re qualitatively different questions, and “never had” really belongs to a different scale than the rest of these questions. It might make the survey longer but I’d argue a better survey design would be to give them the option of selecting how many times they’ve had the beer and THEN ask them, if they’ve had it, how they feel about it.
All questions meant with good humor and without rancor! Asheley’s link on facebook got me here
First the sample: because this is a craft beer-oriented list of beers that are strictly craft and local to DFW I probably have a skewed sample. At first I targeted friends, then they shared it with people I don’t know but are probably craft beer nerds. Next I put it on Reddit in /r/DFWBeer — so definitely a craft sample. Following that I put it on Reddit in the /r/Dallas subreddit — to reach a broader audience.
If someone were to respond to the survey and not really be into craft beer — then they’d probably get excluded for non-responses. But this brings up a fair point: it should probably be titled “Dallas’s Favorite Craft Beer Made Somewhere Within a Reasonable Distance from DFW” — but that’s not as catchy.
Second: PCA vs. CA. I designed the survey specifically for use with CA. This is because the responses were categorical — you had to choose a sentence to express your opinion. Not a number. In this case there were only categories. PCA can’t cope with categories (except in a very, very specific case, which actually ends up being equal to a CA). Because the data here are the cross-product between two nominal data sets, which produces counts, the approach most often thought of is Χ2. CA performs a Χ2 preprocessing and then does the SVD with constraints applied to both the left and right singular vectors.
Even though in practice an ordinal scale is used, I am still very anti-PCA for ordinal data. It violates many of the assumptions of PCA and the usual preprocessing that goes with it. Ordinal is more easily converted to categorical without loss or misrepresentation of information. Further, with CA, there are a few tricks to use ordinal directly.
Third: collapsing. Yeah — the collapsing is just to simplify a few things. First, it’s pretty clear that OK and DO NOT LIKE are essentially the same. So combining them loses little if anything. Next, I chose to combine the non-responses as a way of keeping non-response information, while essentially boosting the actual responses. Also the NO OPINION category was rarely used. You can see that, initially, NO OPINION is very close to where the axes meet. This means that NO OPINION responses provided very little information to the analysis anyways.
Good enough! I’d still probably argue that “never had it” doesn’t really fall under taste preference, because no opinion and never are really qualitatively different kinds of non-response. They get at different reasons for non-response. Beer opinions are really a treatment-on-the-treated sort of effect anyway. You don’t really care about what NOT drinking a beer has on their opinion of the beer. So doing your analysis on the “treated” – those who have at least had the beer once – is probably reasonable, with some discussion of dropped data. Or will CA choke if you’ve got response-level missing-ness? We don’t really touch on any sort of components-type analysis except very briefly.
I don’t have a website, I just wasn’t reading carefully and put a title there.
One last thing I’d be curious about – if you could do some sort of components analysis on flavor profile, if some sort of unified database for it exists, to see if you get any clustering.
Components analysis of flavor profiles do exist. You can find an overwhelming amount of it in the Journal Food Quality & Preference. However, if you look at the data I provide in the ExPosition package — there are some beer tasting notes provided by individuals and groups. I typically use those as examples.
If much larger data sets were to exist and were publicly available, then, yes, I would try my best to essentially make a NetFlix or Amazon recommendation engine for beer.
Sorry, that was unclear! I meant to say I’d be interested to see if the clustering of favorites in Dallas could potentially be explained by similar flavor profiles. Just curious what might be driving the preferences.
In this case — probably not. The ones marked as favorites are really distinct (in terms of style, and even water chemistry and yeast strains). The only real common factor is relatively high ABV.