Hello again. It’s me, Derek… from the website derekbeaton.com. I’m here to sell you some Encyclopedia Britannica.
As a PhD student I acquire sustenance from the two major food groups: beer and coffee. I also like to pretend I’m an expert in those things, but, really, I’m probably just a snob about them.
But I’m not the only snob about these things. Dallas, clearly, is really into its beer. But a little less obvious is that Dallas appears to love its coffee much the same way — craft and/or local. In fact, the coffee scene in Dallas right now parallels the beer scene about 3-4 years ago: lots and lots of bars and restaurants catering to the craft beer enthusiasts (snobs), with a handful of breweries. We have countless places to get some great local or Texas-based coffee, and we have quite a few roasters: Cultivar, Noble Coyote, Oak Cliff Coffee Roasters, Full City Rooster, Novel, White Rock (and all the ones throughout the rest of the metroplex) with more on the way.
WHICH MEANS WE HAVE THE CHANCE TO GET NERDY — and statistically determine the best coffee places in Dallas. Like before, I aggregated the ratings from both Facebook and Yelp for all the local/independent coffee shops in Dallas. These primarily exist within the area created by 635, the Tollway, loop 12, and Bishop’s Arts. Let’s take a look:
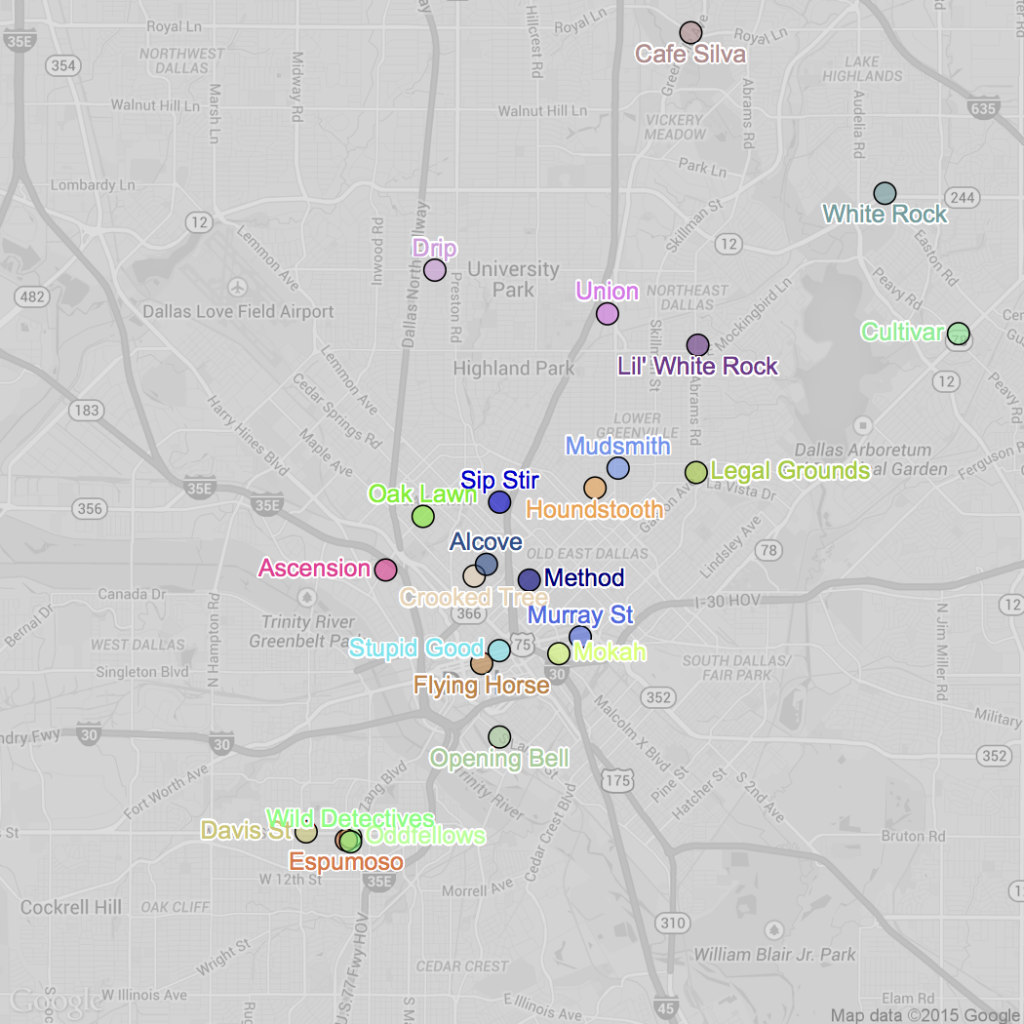
It wasn’t an easy list to cultivate in part because — we’re a lucky crowd with some great coffee options all through out town.
Now let’s get to one other fact about coffee places in Dallas: they are almost all entirely distinct from one another. Very few of these coffee shops have a lot in common with one another except that they generally use local or at least Texas roasted beans and/or are not part of a conglomerate. So let’s take a look at some of these coffee shop categories:
- Some of the coffee shops are also bars (e.g., State St/Alcove, Ascension, Mudsmith)
- Some serve as venues for art, music, and/or worship (e.g., Union, Mokah)
- Some are super nerdy (in the good way) about their coffee techniques (e.g., Method, Cultivar)
- Some also focus quite a bit on food (e.g.,Oddfellows, Legal Grounds)
- Some are actually simple coffee shops (e.g., Murray St., Café Silva)
- Some are located in, or are bookstores (e.g., Black Forest, Serj)
And then there’s The Wild Detectives which is almost all of the above. Plus a place for dogs in sidecars.
In sum — there’s a coffee shop for nearly any personality or occasion in this town. Like I said — it looks like the beer scene from about four years ago. Enough background… it’s stats time.
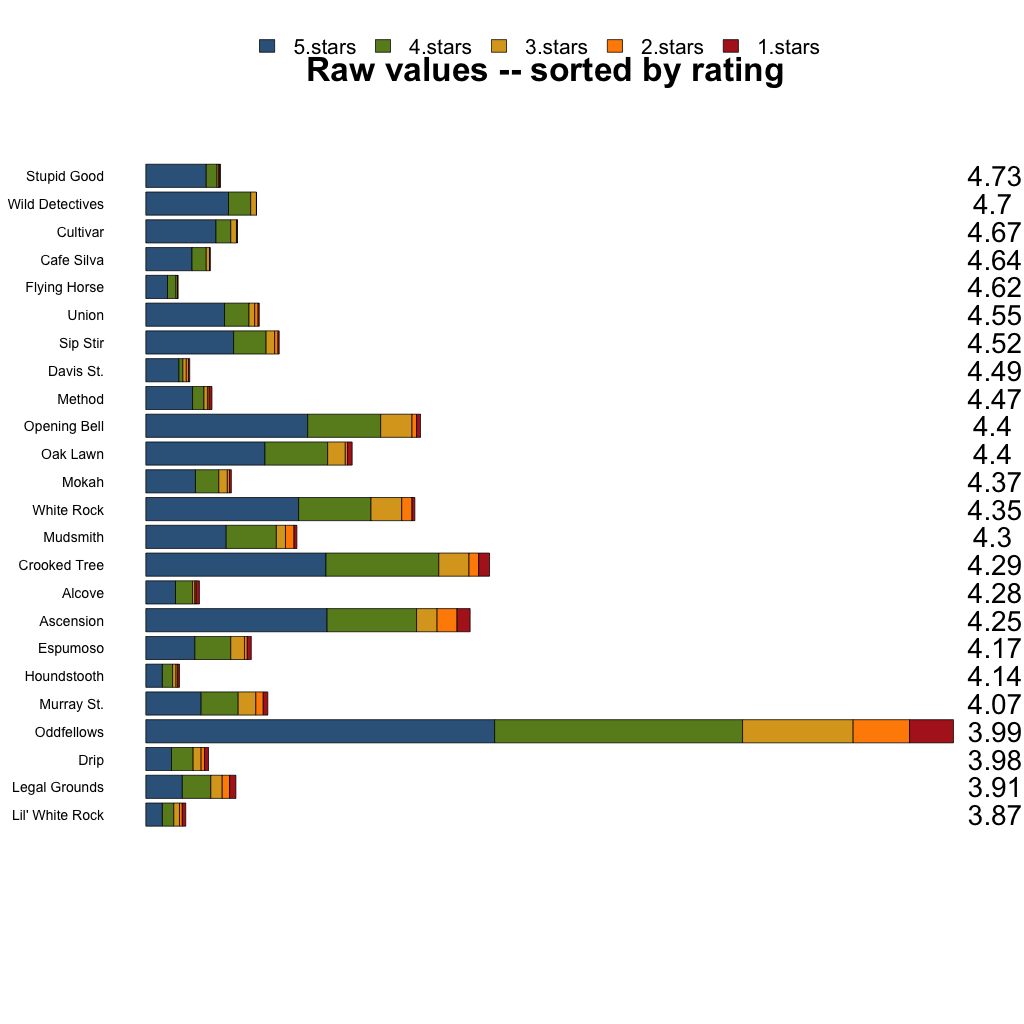
Now there’s something a little unfair here… some coffee shops have a ridiculous amount of ratings (i.e., Oddfellows) and some have a much smaller amount (e.g., Houndstooth). So let’s make these bars relative, that is, the total number of 5, 4, or [3, 2, 1] stars divided by the total number of ratings:

Ratings systems like this tend to be a bit flawed. For example, the movie “50 Shades of Grey” has 4.1 out of 10 stars on IMDB.com. Does that mean it’s generally receiving middle responses from most people?
No, no it absolutely isn’t. It’s easy to get an “average” rating when the underlying distribution makes absolutely no sense.
In order to understand how people really perceive Dallas’s coffee shops we need to get fancy with our stats. So let’s turn to one of my favorite statistical methods: Correspondence Analysis (CA). CA is a technique that takes a large table made up of a bunch of variables (ratings) and turns them into new variables that better represent what’s happening2. CA produces new variables called “components” — which are the horizontal and vertical axes (lines) in the following pictures. The other really nice thing about CA is that it can handle data in a correct way when the number of items are different. Here, the number of ratings per coffee shop is quite different. Well, CA makes it so things are fair between all these coffee shops — kind of like the relative percentages above.
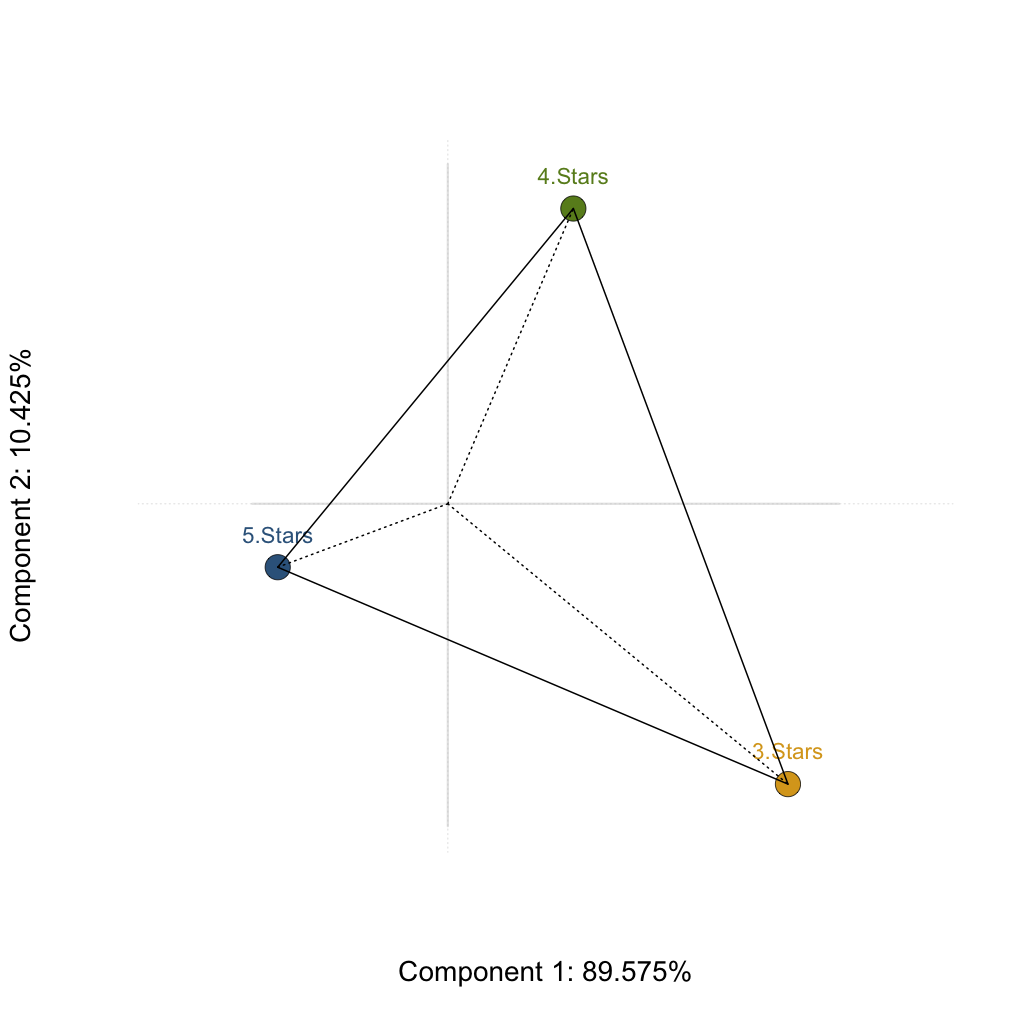
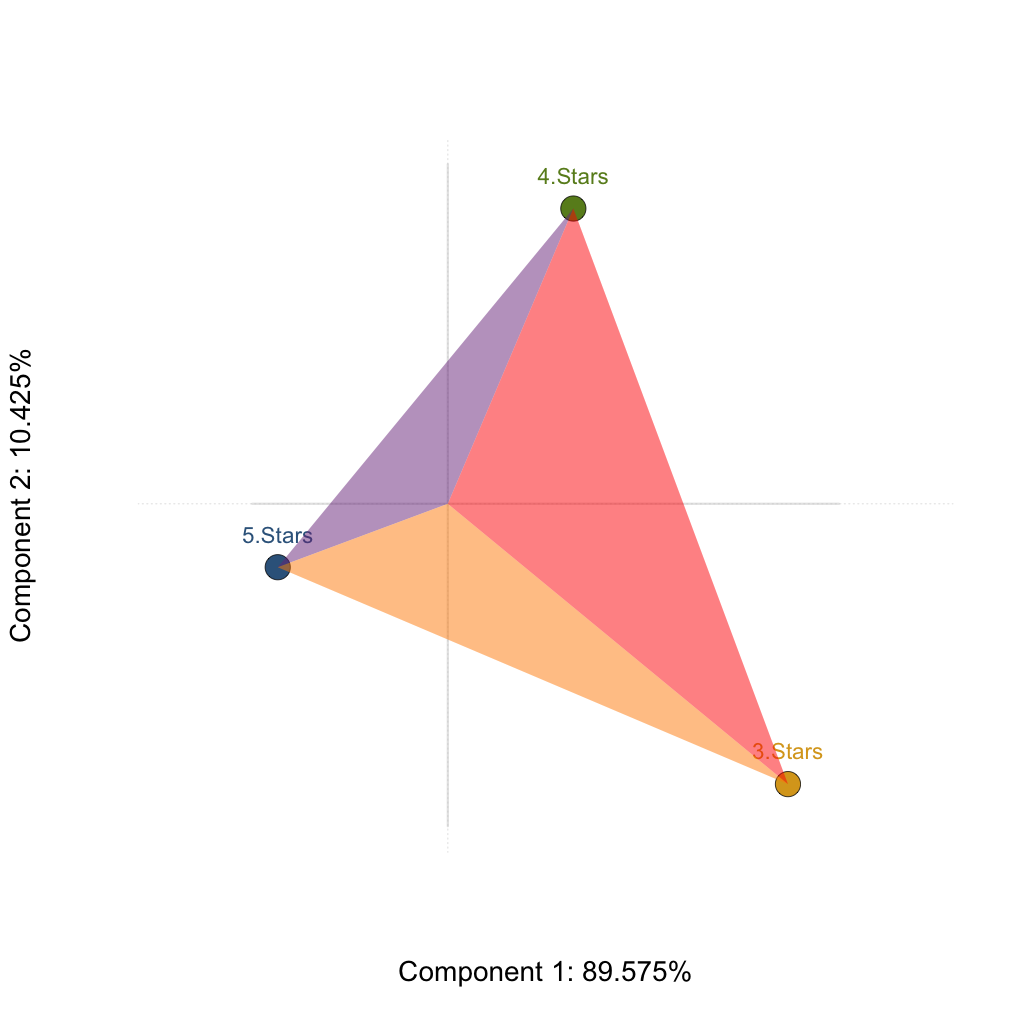
Note that repeated sentence: “which coffee shops are more likely to receive [some number] star ratings than others” — that means this is a relative interpretation. A shop that is close to a 3 doesn’t mean it gets more 3s overall — just that, proportionally, it receives more 3s than other shops.
So, the above two image shows us that (more likely to receive) 5 stars shops are on the left side, (more likely to receive) 4 star shops to the upper right, and (more likely to receive) 3 star shops to the lower right. Let’s see how the shops are configured:
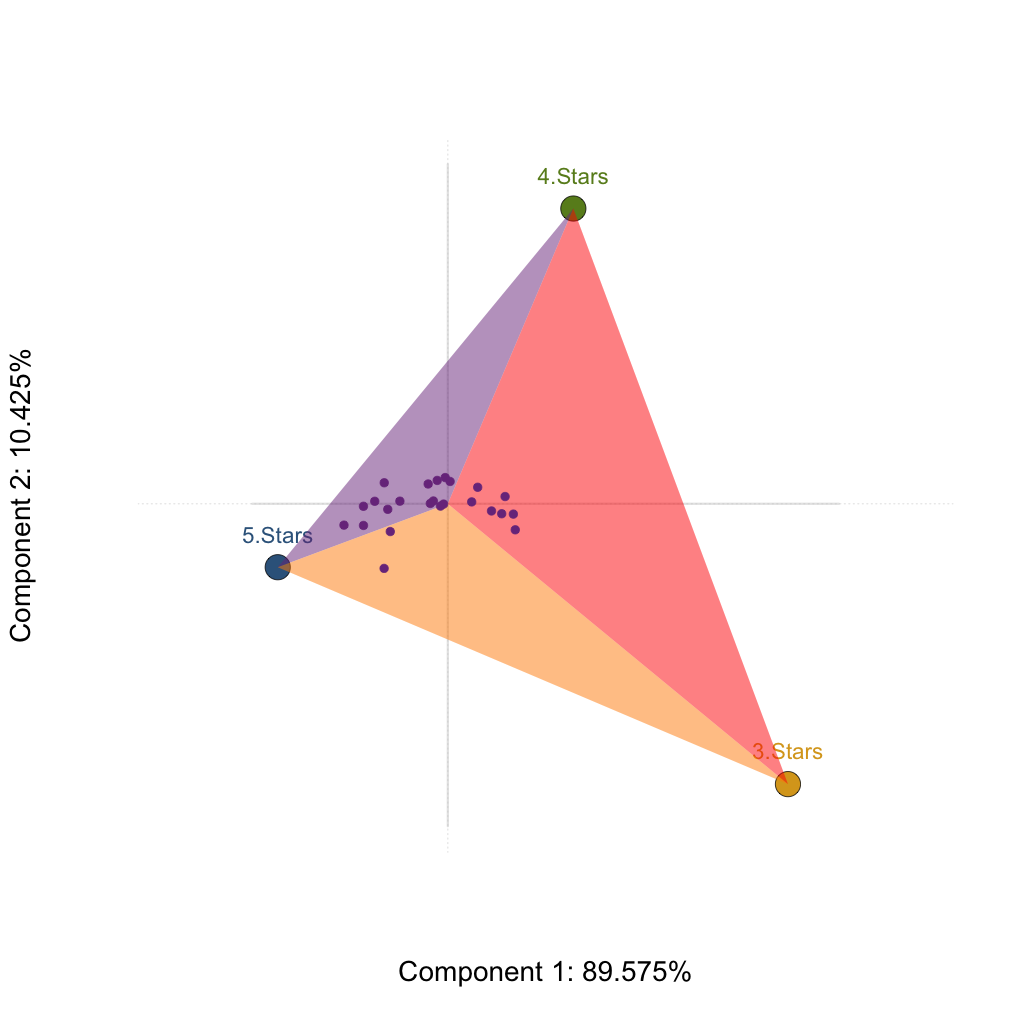
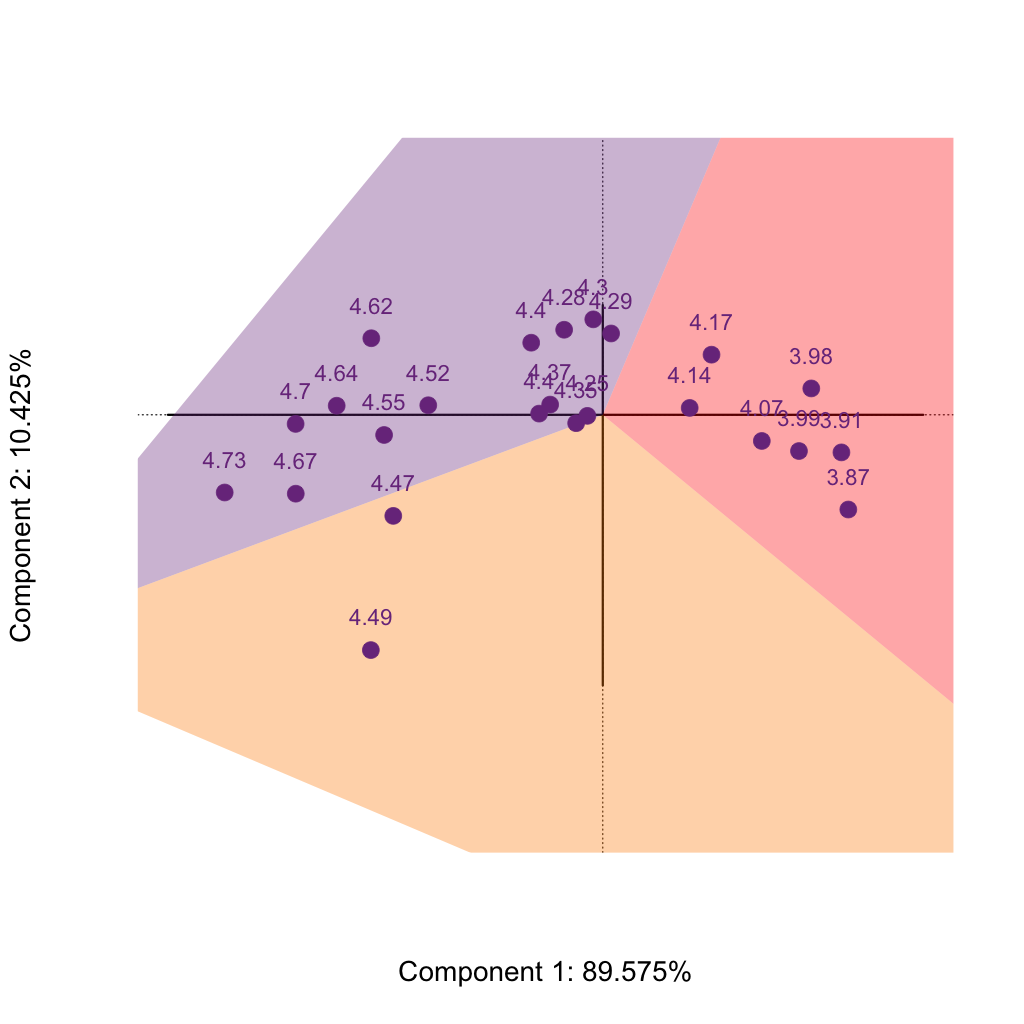
Anyways. With these ratings systems, they can still be informative. But they aren’t very informative when you just average the stars from a very broad and unrefined rating system.
In the picture above, we have 3 zones to describe our coffee shops: (1) The Red Zone is coffee shops that have relatively more 3 (and 2, and 1) star and 4 star ratings than other places, (2) The Orange Zone is the “50 Shades of Grey” zone — these coffee shops get their average rating from a bimodal distribution: People that love (5 star) the places and people that definitely don’t (3, 2 and 1 star ratings), and (3) The Purple Zone: these shops generally receive more 5 star and 4 star ratings, proportionally, than other shops.
Another small note: any coffee shops at the middle, where the horizontal and vertical lines cross, are essentially the average coffee shops.
So, which shops are these in all these weird 50 Shades of Grey zones and what not…?
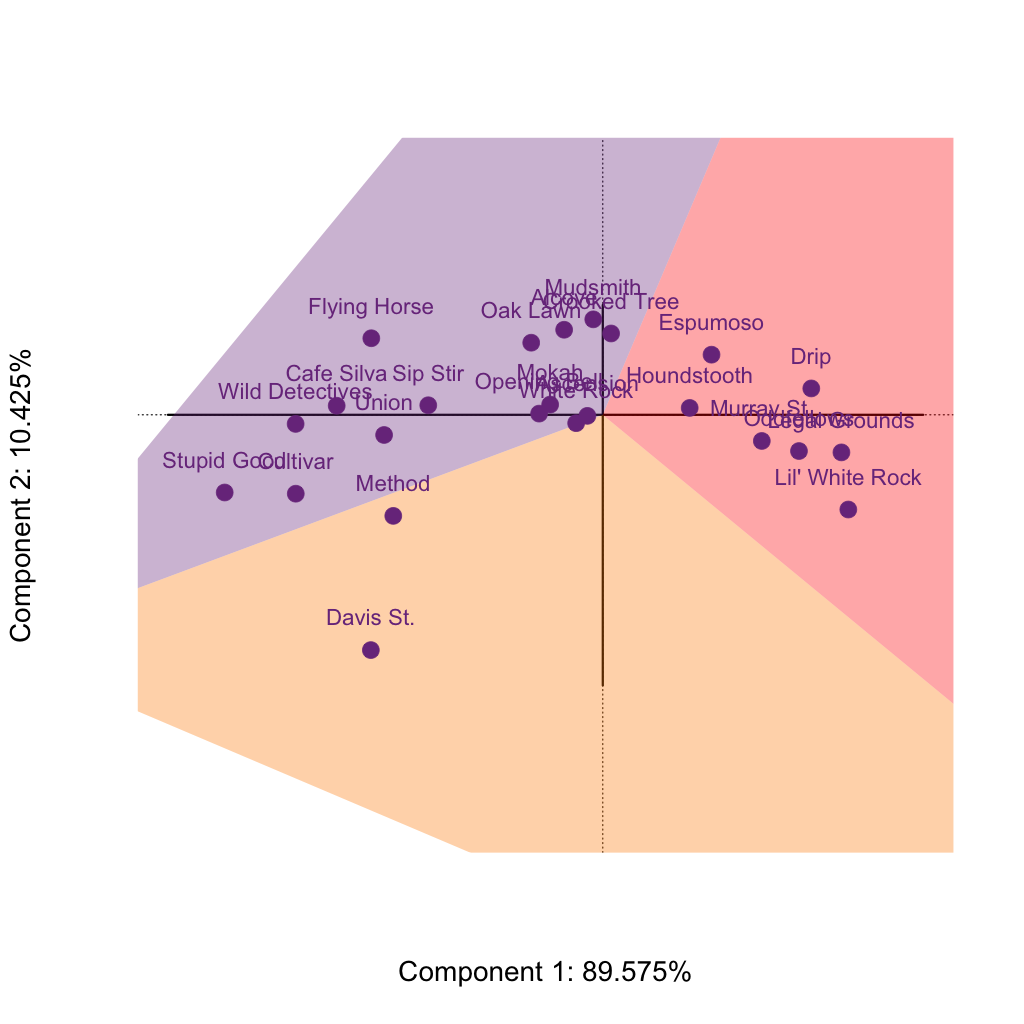
Now that purple zone is where we want to dive into. There appears to be two groups: the A students–closer to the origin–and the A+ students–the ones most to the left.
At this point you’re thinking “SHUT UP DEREK I’VE BEEN READING THIS FOR FAR TOO LONG TRYING TO FIND OUT WHICH COFFEE SHOP TO GO TO AND IT HAS DELAYED MY COFFEE CONSUMPTION AND THUS I AM IRRITATED AS IS EVIDENT THROUGH THE USE OF CAPITAL LETTERS RUN ON SENTENCES AND LACK OF PUNCTUATION.”
Well you’ll just have to wait, because I have something important to show you. And I’m going to show you through the power of an animated .gif. The .gif below shows us each coffee individually (purple dot) and how their ratings differ from Facebook ratings (blue dot) with an arrow towards their Yelp ratings (red dot):
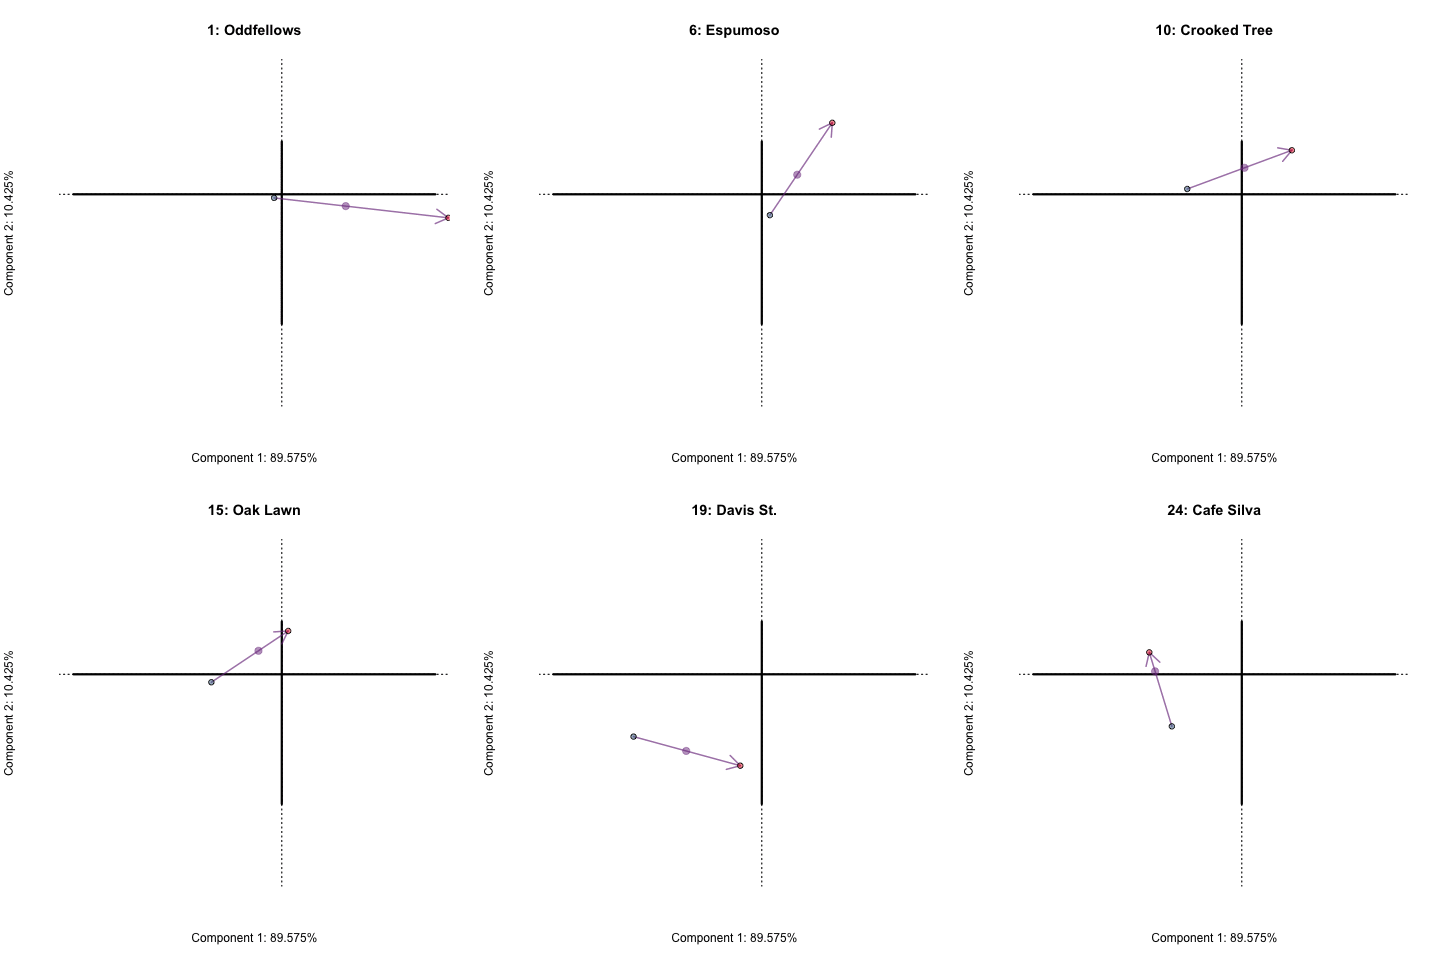
Both Mokah and Café Silva have overall positive ratings (they’re A to A+ students here). But they’re the only two where the ratings are better on Yelp than Facebook — completely counter to every other shop. And I even made sure to grab the hidden ratings from Yelp.
So how can we rank these coffee shops and give them a new rating? Well, that’s where a classic statistical technique comes in: linear regression.
All of the coffee shops will now get a new rating. This new rating is computed by using the original overall rating from above as the dependent variable, where the positions of the coffee shops from Correspondence Analysis3 are used as predictors4.
So, let’s get down to the important question: what are Dallas’s top 5 coffee shops, and what are their new ratings?
- Stupid Good — 4.75
- The Wild Detectives — 4.68
- Cultivar — 4.65
- Café Silva — 4.63
- Flying Horse — 4.61
So, where are they?
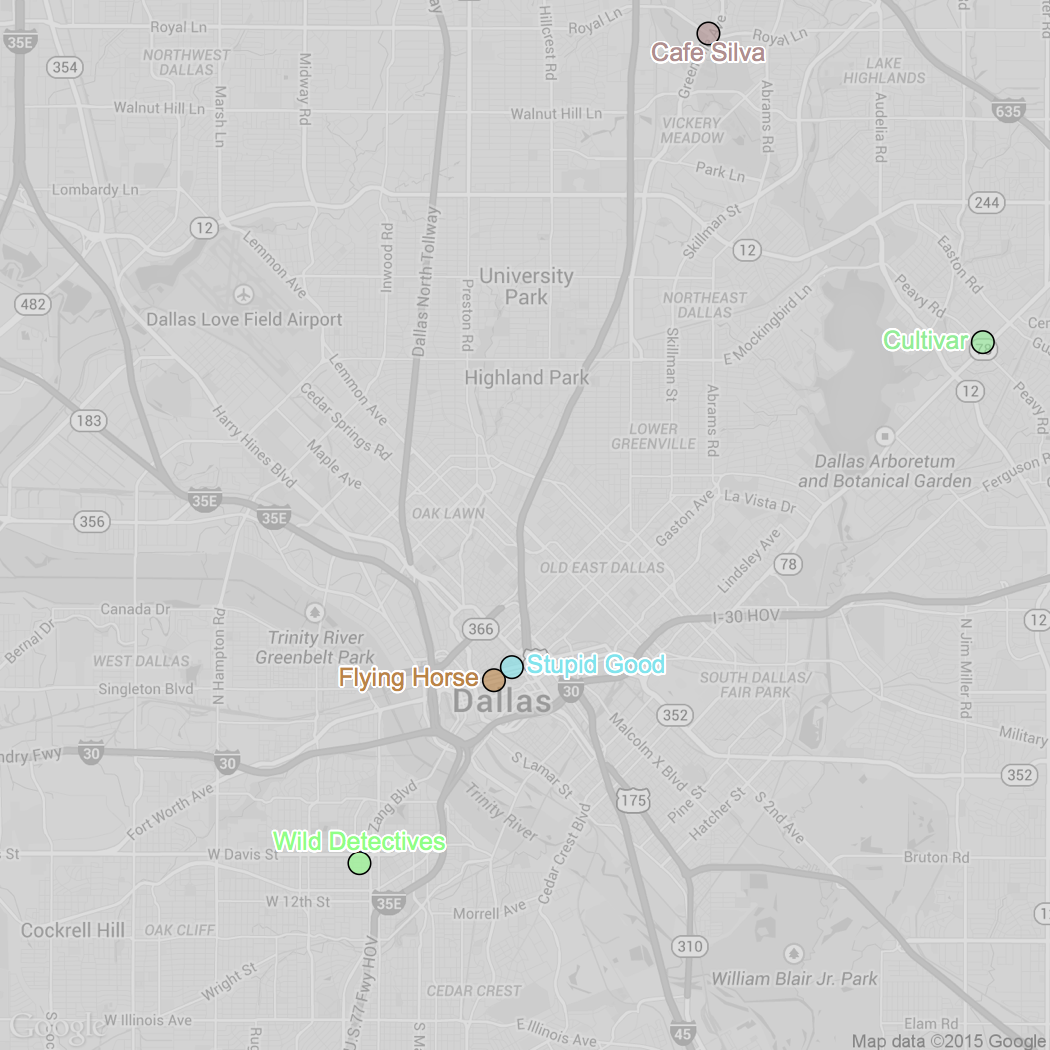
Now back to all that distinctness between shops — you really couldn’t ask for a more diverse set of coffee shops to be the top 5 — all have a unique personality, relative unique locations, wide array of coffee beans (including 3 local roasters: Oak Cliff at Stupid Good and The Wild Detectives, Noble Coyote at Café Silva, and Cultivar at Cultivar).
Given how far apart these places are, now we can answer a bonus question: Which neighborhood has the best coffee? That is, if you had to be trapped in a particular neighborhood in Dallas, and the primary condition is that you just need to be surrounded by great coffee shops, where should that be?

It’s pretty much one of the most boring neighborhoods–where everything is closed tightly by 5pm–is actually the best neighborhood for coffee. Go figure.
And the final re-rankings of coffee shops in Dallas:
| Coffee Shop | Rating |
| Stupid Good | 4.8 |
| Wild Detectives | 4.7 |
| Cultivar | 4.7 |
| Cafe Silva | 4.6 |
| Flying Horse | 4.6 |
| Union | 4.6 |
| Method | 4.5 |
| Sip Stir | 4.5 |
| Davis St. | 4.5 |
| Oak Lawn | 4.4 |
| Alcove | 4.3 |
| Opening Bell | 4.3 |
| Mokah | 4.3 |
| Mudsmith | 4.3 |
| White Rock | 4.3 |
| Crooked Tree | 4.3 |
| Ascension | 4.3 |
| Houndstooth | 4.2 |
| Espumoso | 4.1 |
| Murray St. | 4.0 |
| Drip | 4.0 |
| Oddfellows | 4.0 |
| Legal Grounds | 3.9 |
| Lil’ White Rock | 3.9 |
All analyses performed in R. Correspondence Analysis was performed with the ExPosition package – a package created by particularly attractive and smart people. Maps were created in R with the RgoogleMaps and MASS packages. Some code was borrowed and adapted from Everyday Analytics and Stackoverflow.
Code and data available, for the nerds who are so inclined.
Footnotes:
1There are some great shops outside of Dallas: Avoca and Brewed in Ft. Worth, a few Buon Giorno locations, Generator in Garland, Pearl Cup in Richardson… the list goes on.
2For the stats nerds, technically both the coffee shops and the ratings are variables. The observations (people making ratings) are kind of hiding. Each person simply helps increase the number of responses within a particular cell of this table. CA is analogous a principal components analysis but for data more suited for χ2 analyses.
3These are called “Component Scores” or “Factor Scores”.
4For the stats nerds: one lovely property here is that the components (axes, lines) are orthogonal, which makes for an easy regression! Furthermore, this is a components-based analysis where the components are used as predictors in a simple regression… You may be more familiar with this under a different name (with a different technique): Principal Components Regression.

Hello from Serj in downtown Dallas! We enjoyed reading your article and appreciate the mention. How many reviews would be required to be considered for the next update of your coffee reviews? We very much appreciated the format of your reviews and look forward to serving you one day. Ciao!
Hi John!
I left some of those details out so I didn’t bore people with stats. But, thanks to your question, now I have the chance to be boring (I really do enjoy boring people with stats)!
First, I’ll explain how I decided the threshold for inclusion, then I’ll explain the (statistical) rationale behind it.
From the first figure or two, you can see some long and some short bars. The longer the bar — the more overall ratings. You can also see this in the .csv file in the code/data .zip file (which is a month out of date by now).
I used total number of reviews across all the shops to determine a threshold. However, I actually excluded Oddfellows because it has a disproportionately high number of reviews.
So, I took the total number of reviews I had (excluding Oddfellows), and looked at the proportion of reviews per shop (a percentage).
Any shops with a total number of reviews that fell below 1% of total responses were excluded. With that threshold, some places on my current list barely made the cut — I wanted to be as inclusive as possible. Unfortunately, that meant I dropped some very interesting and exciting places that have recently opened.
The (statistical) rationale behind it is kind of an easy one: not enough data. Places with a total number of reviews under the 1% threshold would have one of two things happen:
(1) look like one of the best or
(2) look like one of the worst.
Statistically, it boils down to something called variance. Without enough data points (here: reviews), the variance will either be artificially high or artificially low.
I think in a few months, places that didn’t make the threshold this time will be OK to include next time (I do plan on re-doing the analysis again, probably towards the end of summer).
I’ll be sure to say hello when I stop by!
Hello there, hope this note finds you well and smiling. Do we have enough reviews to be considered being added to your list? Appreciate you!
Hi John,
Thanks for checking in again! I’m going to collect the data again soon. Hopefully the next version of this analysis will be ready by Labor Day.
I’ll make sure to keep you updated — you’ll probably be the first to know!
Cheers,
-Derek
Thanks Derek, look forward to being included.
Hi Derek, any timeframe on updating; would love to be included!
It comes up in search results when looking for Serj in Dallas, many customers have asked why we’re not included. Sending smiles. John.
Hi again John,
I will try to get to this as soon as possible. My dissertation has kept me quite busy and away from these types of analyses (which I love to do, but have no time to do so). As soon as this pesky dissertation goes away, I’ll provide an update.
Cheers,
-Derek